Introduction
An interactive system that empowers students to make informed food choices through real-time data, gamification, and personalised insights.
Young students have no meaningful way to understand what they are eating at school, or why it matters – so we designed a data-driven cafeteria system that made nutrition visible, social, and actionable. My role was to build the research case for why this problem was worth solving and to map the human experience it needed to serve.
The Brief
“Design a social and technical intervention that helps users meaningfully and responsibly collect data from other people and/or their local environment, for the purposes of living well together.”
Open Lab
Feedback & Outcome
Following the demonstration, we gathered feedback from approximately 25 respondents — invigilators, peers, and visitors who attended the demo day. We asked them six questions about the system, its design, and its potential real-world impact.
Positive on the system overall
Said it would motivate healthier eating
Would you use this system in a school?
22 of 25 respondents
Would you use it if you were a child?
21 of 25 respondents
Would it motivate you to eat healthier?
19 of 25 respondents
Did you like the design?
23 of 25 respondents
Did you like the gamification feature?
20 of 25 respondents
Did the model help explain the system?
24 of 25 respondents
What people said...
“The gamification aspect is brilliant. Competitive kids would absolutely engage with this.”
Invigilator“The model made the whole concept immediately clear.”
Invigilator“I was impressed that it ran entirely on a Raspberry Pi. That is a genuinely deployable solution.”
Invigilator“The decision not to use calories or good and bad labels shows real maturity in the design thinking.”
Peer ReviewSuggested improvements...
“The nutrition labels could be even simpler for younger children. Maybe just three categories instead of five.”
Invigilator“I would love to see this connected to a proper database so the data persists across days and weeks.”
Peer Review“The leaderboard would be more motivating if students could see their personal streak alongside the class score.”
Invigilator“It would be great to see this tested with actual students in a real school canteen setting.”
Peer ReviewDiscover
Our design process
As a group, we applied a fast-tracked version of the Double Diamond process to guide our work from problem to solution. Given the four-week timeframe, we compressed the discover and define phases into a focused ideation sprint, moving quickly from broad exploration to a clear problem statement. The process gave us a structured way to think, ensuring we explored the problem space thoroughly before committing to a direction — and kept us grounded in our core brief, using data mindfully and responsibly to help people live well together. We also made the most of everyone's expertise, distributing tasks according to each team member's strengths so that research, design, and engineering could move forward in parallel.
Finding the space
The brief gave us four domains to work within — smart cities, social media, sharing economies, and public services. Rather than jumping to a solution, we started by mapping what mattered to us across each one, using card sorting to pressure-test our instincts: writing out values, user groups, and potential impact areas, then physically moving them around until patterns emerged.
Schools kept coming up. Not because food is an obvious design problem, but because of what food enables. A child who eats well concentrates better, learns more effectively, and develops stronger cognitive foundations. We were not just interested in lunch. We were interested in what lunch makes possible.
Proving the problem
Once we had our space, I needed to answer one question before the team could move forward: is this actually a problem worth solving, or does it just feel like one? I went into the literature. What I found was consistent and alarming across three countries — the trend was getting worse, not better.
18.5%
of US children aged 2–19 were living with obesity1
22%
of children leaving primary school in England were overweight or obese2
14%
of young people in the Netherlands were overweight, with numbers growing3
25–33%
of children's total daily energy comes from school food in the UK4
The statistic that grounded everything was simpler: eating habits begin forming at ages 6–7 and are genuinely difficult to change after that point, and children get between a quarter and a third of their total daily nutrition from school meals. That combination — early habit formation, significant nutritional exposure, and a captive environment — made schools not just a reasonable place to intervene, but the most logical one.
Between 40 and 50 million school children worldwide are now classified as obese, with prevalence highest in the Americas. Obese children are significantly more likely to become obese adults, increasing their risk of cardiovascular disease, type-2 diabetes, various cancers, and premature death. Critically, interventions to stimulate healthy dietary behaviour must start early — eating habits formed during childhood and adolescence are likely to persist into adulthood. In 2018, approximately 18.5% of US children and adolescents aged 2–19 were obese; in the Netherlands, 14% of young people are overweight and growing; and in the UK, 23% of children starting school at age 4–5 are an unhealthy weight, rising to 35% of children by the end of primary school.
- Survey Years
- Seriously overweight (Obese)
- Moderately overweight
Over 50% of children with obesity go on to develop related chronic conditions. Type 2 diabetes cases among children in the UK rose 57% between 2015 and 2021, and between 12–15% of adolescents show signs of asthma or eczema linked to dietary deficiencies. Three manifestations of the same underlying problem: children are not getting the nutrition they need, and schools — where they spend most of their day and consume up to a third of their daily food — are the most logical place to change that.
Obesity
Asthma & Eczema
Diabetes
What students are actually being offered
Knowing obesity was rising wasn't enough — I needed to understand what was happening specifically inside schools. Almost 90% of all secondary schools in the Netherlands have a school cafeteria and/or soft drink vending machines, and 80% have vending machines selling snacks and candy bars. Rathi et al. (2018) surveyed 1,026 students across 9 private schools. The findings were stark.
- French Fries
- Pizza
- Cakes
- Other, healthier options
French fries were available in over 80% of canteens, pizza in over 75%, and cakes in over 65% — while other, healthier options were available in fewer than 20%. Only 3.6% of students were satisfied with the nutritional quality of food in their school canteen. The problem wasn't just that children were making bad choices — the environment wasn't giving them good ones. With junk food readily available at cheap prices, and a lack of fresh fruit, there is a direct need to enhance the availability and visibility of healthy foods in school cafeterias.
Reasons we chose this problem
Our team was diverse — an Indian researcher who had seen health disparities based on socioeconomic class, a former certified teacher in America who had observed children's eating habits first-hand, and others who brought their own experiences. The research confirmed what we felt personally.
Poor nutrition directly correlates with lower school performance, attendance, and classroom behaviour. The brain depends on nutritional intake for neurotransmitter production.
A balanced diet prevents obesity, diabetes, cardiovascular disease, and micronutrient deficiencies — all of which are rising among children and adolescents.
Children mimic behaviours from adults and environments. Schools can instil habits of nutritious eating that carry forward into adulthood if introduced early enough.
For many students, school meals contribute a significant portion of daily nutrition, especially those from low-income households. Food access is a social equity issue.
Healthy eating initiatives involve parents, teachers, and community stakeholders, strengthening ties and promoting collective efforts toward student wellbeing.
Competitive analysis
Before designing anything, we mapped what already existed in this space. Three products came up repeatedly: Fusion, NHS Food Scanner, and Be Food Smart. Each solved part of the problem. None solved all of it.
| Feature | Fusion | NHS Food Scanner | Be Food Smart |
|---|---|---|---|
| Gamification | ✓ | ||
| Parent involvement | ✓ | ||
| Real-time school integration | |||
| Nutritional details | ✓ | ✓ | |
| Student food rating | ✓ | ||
| Future menu voting | |||
| Centralised school database | ✓ | ||
| Allergy notifications | ✓ | ||
| Menu planning | ✓ |
The gap
How might we use responsible, meaningful data collection in schools to make nutritional information visible and social so that students, families, and schools can make better food decisions together?
Define
The cafeteria and home
After discussing our research, it was agreed that improving healthy habits around nutrition would have the largest long-term impact. The cafeteria is where the choice happens. Home is where the choice continues. So we designed a system with two parts: a live cafeteria display that makes nutritional information visible and social at the point of choice, and a companion student app that sends personalised data home — giving students and parents the information they need to make better decisions together.
User Personas
The system was designed with just one main user in mind: the student. Every single design choice, from the cafeteria screens to the mobile app, was made to make their school experience better and help them reflect on it later.

“Which one will I regret less? I'll just pick whatever my friends are having.”
Tommy lives with parents who both work full time; dinner is a family meal, but lunch is his own responsibility. He understands that his food choices are important, but he doesn't focus on being healthy — he cares most about doing well, fitting in, and making his classmates proud. What his friends eat and what looks tasty matter much more to him than nutrition, which leaves him overwhelmed, rushed, and confused when he has to quickly pick his lunch in a loud, crowded cafeteria while worrying about what others think.
Goals
- Make a quick, confident decision at lunchtime without slowing the queue.
- Choose something he'd feel comfortable telling his parents about.
- Be seen making good choices by his peers, not just his parents.
Frustrations
- Too many options with no way to distinguish between them meaningfully.
- Nervousness about holding up the queue.
- No feedback on whether his choice was good until it's too late to act.
- Nutrition information feels aimed at adults, not him.
Needs
- To feel in control of a decision that currently feels arbitrary.
- To understand consequences without being lectured or shamed.
- To belong to something social around food.
- To process information quickly and visually under pressure.
User Flow
User Journey
Storyboard
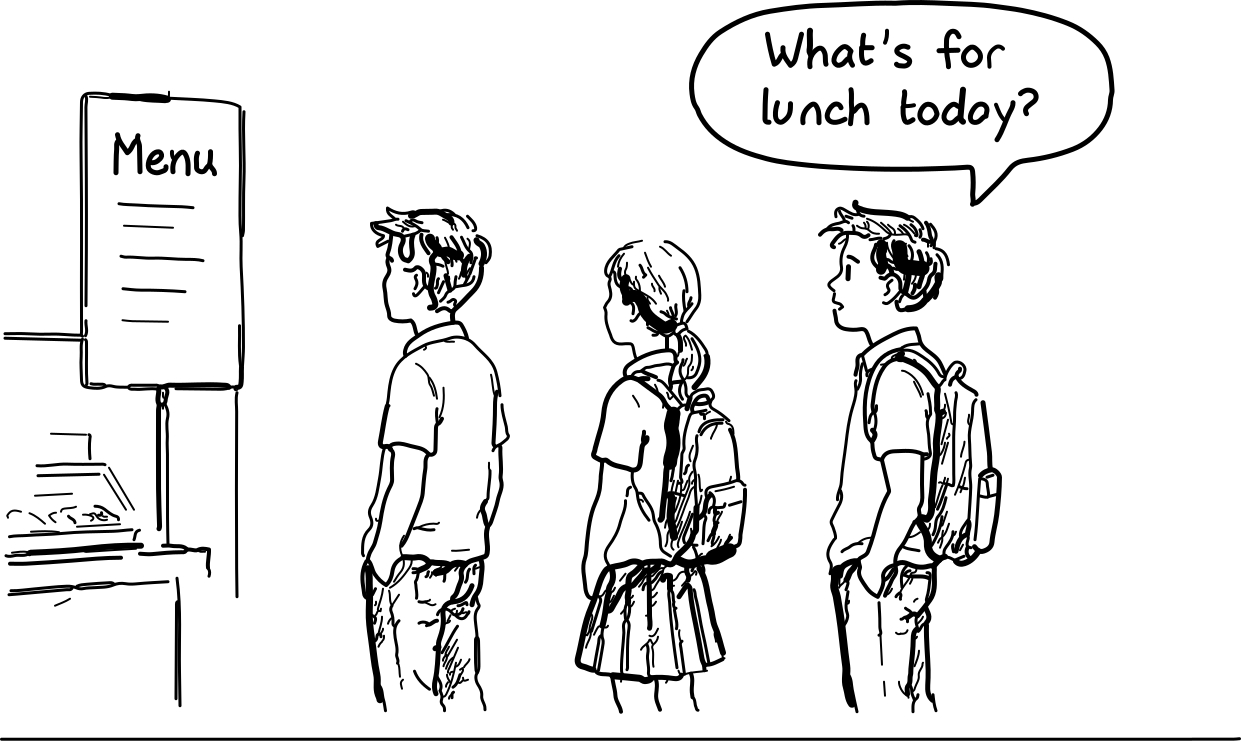
Tommy joins the long queue with no idea what's on the menu
Design constraints
The five reasons that brought us to this problem directly shaped what we could and couldn't build. Before ideation began, the team agreed on three non-negotiables — each grounded in the research.
The information density appropriate for a 12-year-old is different from what works for a 7-year-old. The cafeteria display was designed in two versions — simplified iconography for younger students, detailed nutritional breakdown for older ones.
Calorie counting is a documented contributor to disordered eating in adolescents. We used nutrient categories instead (Protein, Grains, Fruits and Vegetables, Dairy, Fat), framed positively as what each food contains, not what it lacks.
Labelling food as good or bad creates shame and anxiety in young people. Every food in the system is described by what it contains, not judged by what it is. The goal is informed choice, not moral instruction.
Low fidelity wireframes
We sketched wireframes for two distinct views — a public canteen display and a student app — keeping our persona in mind at each stage and considering how our user group would interact with and understand the data being presented.
We referred to existing food and school apps to understand familiar interaction patterns, then stripped away anything that introduced judgment or comparison. This helped us arrive at layouts that feel intuitive to young users while staying true to the constraints we'd set.
Canteen display6
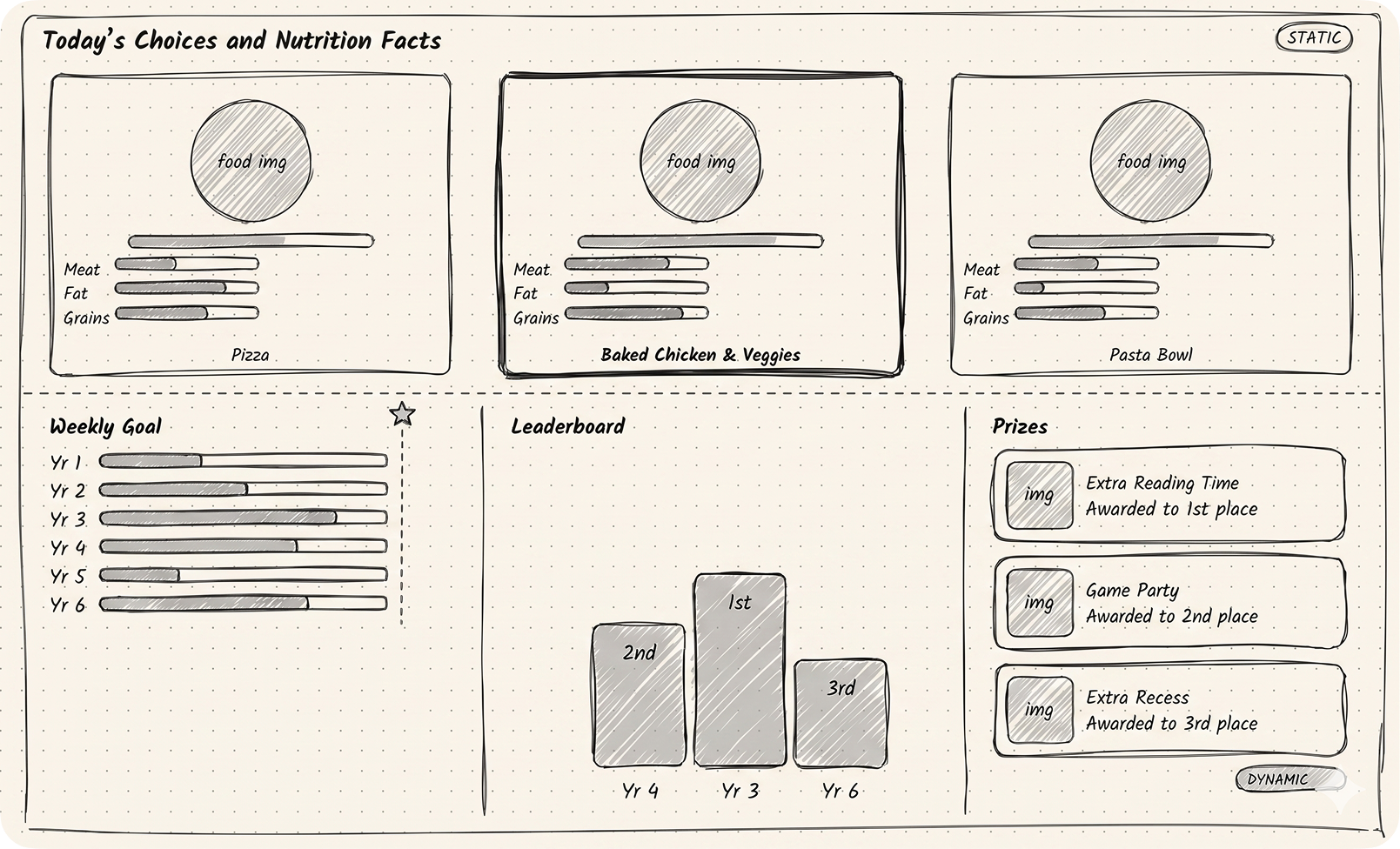
Leaderboard view
Mobile app6
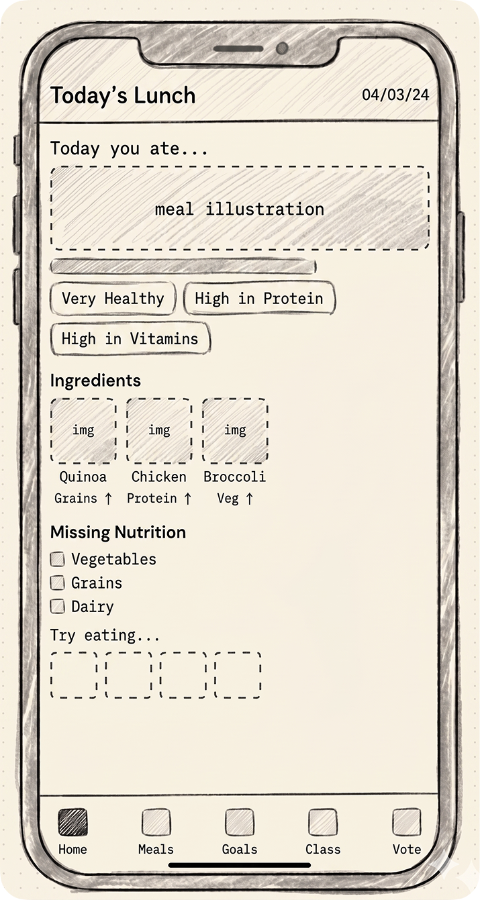
Today's Meals
Develop
Hardware and Software Architecture
We wanted the prototype to be as realistic and usable as possible, so we built a full-stack web application hosted on a Raspberry Pi 4B. The Pi acts as the central hub for the entire system — collecting data, processing it, and powering both displays. The prototype runs two screens: a 10.1" touchscreen at the cashier counter for order input, and a public monitor on the wall showing live data to students and staff, both updating every five seconds. On the software side, the application is built with Node.js, Express and React (MERN stack), accessible to any device on the same network.
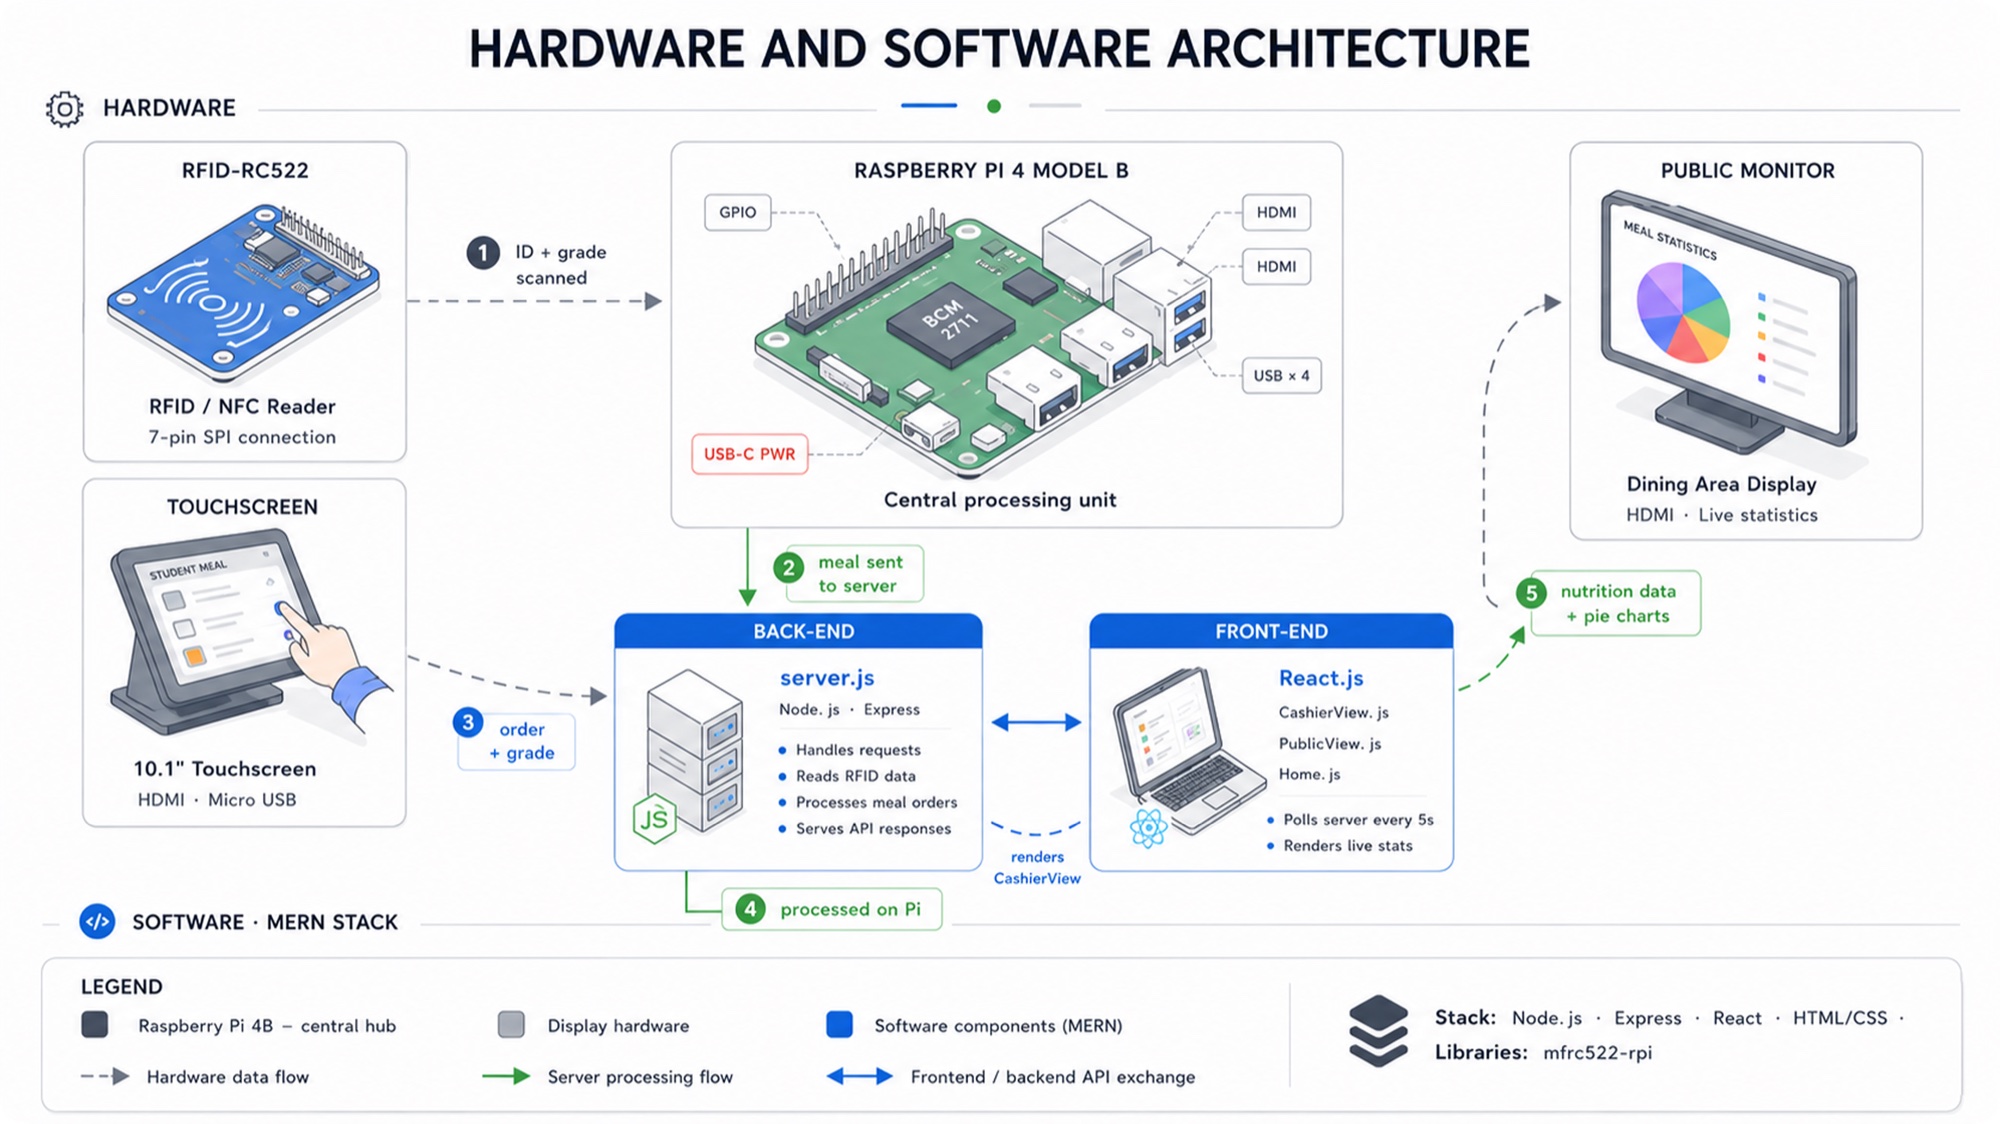
When a student taps their ID card, the RFID-RC522 reader picks up their ID and grade over a 7-pin SPI connection and passes it to the server running on the Pi. The server links that information to the meal the student chose and saves it. Every five seconds, both screens fetch the latest data from the server and refresh automatically — the cashier screen shows the order input interface, and the public screen shows the live meal statistics and charts. Everything runs locally on the Pi through a Node.js/Express back-end, with React powering the front-end on both screens.
Physical Prototype
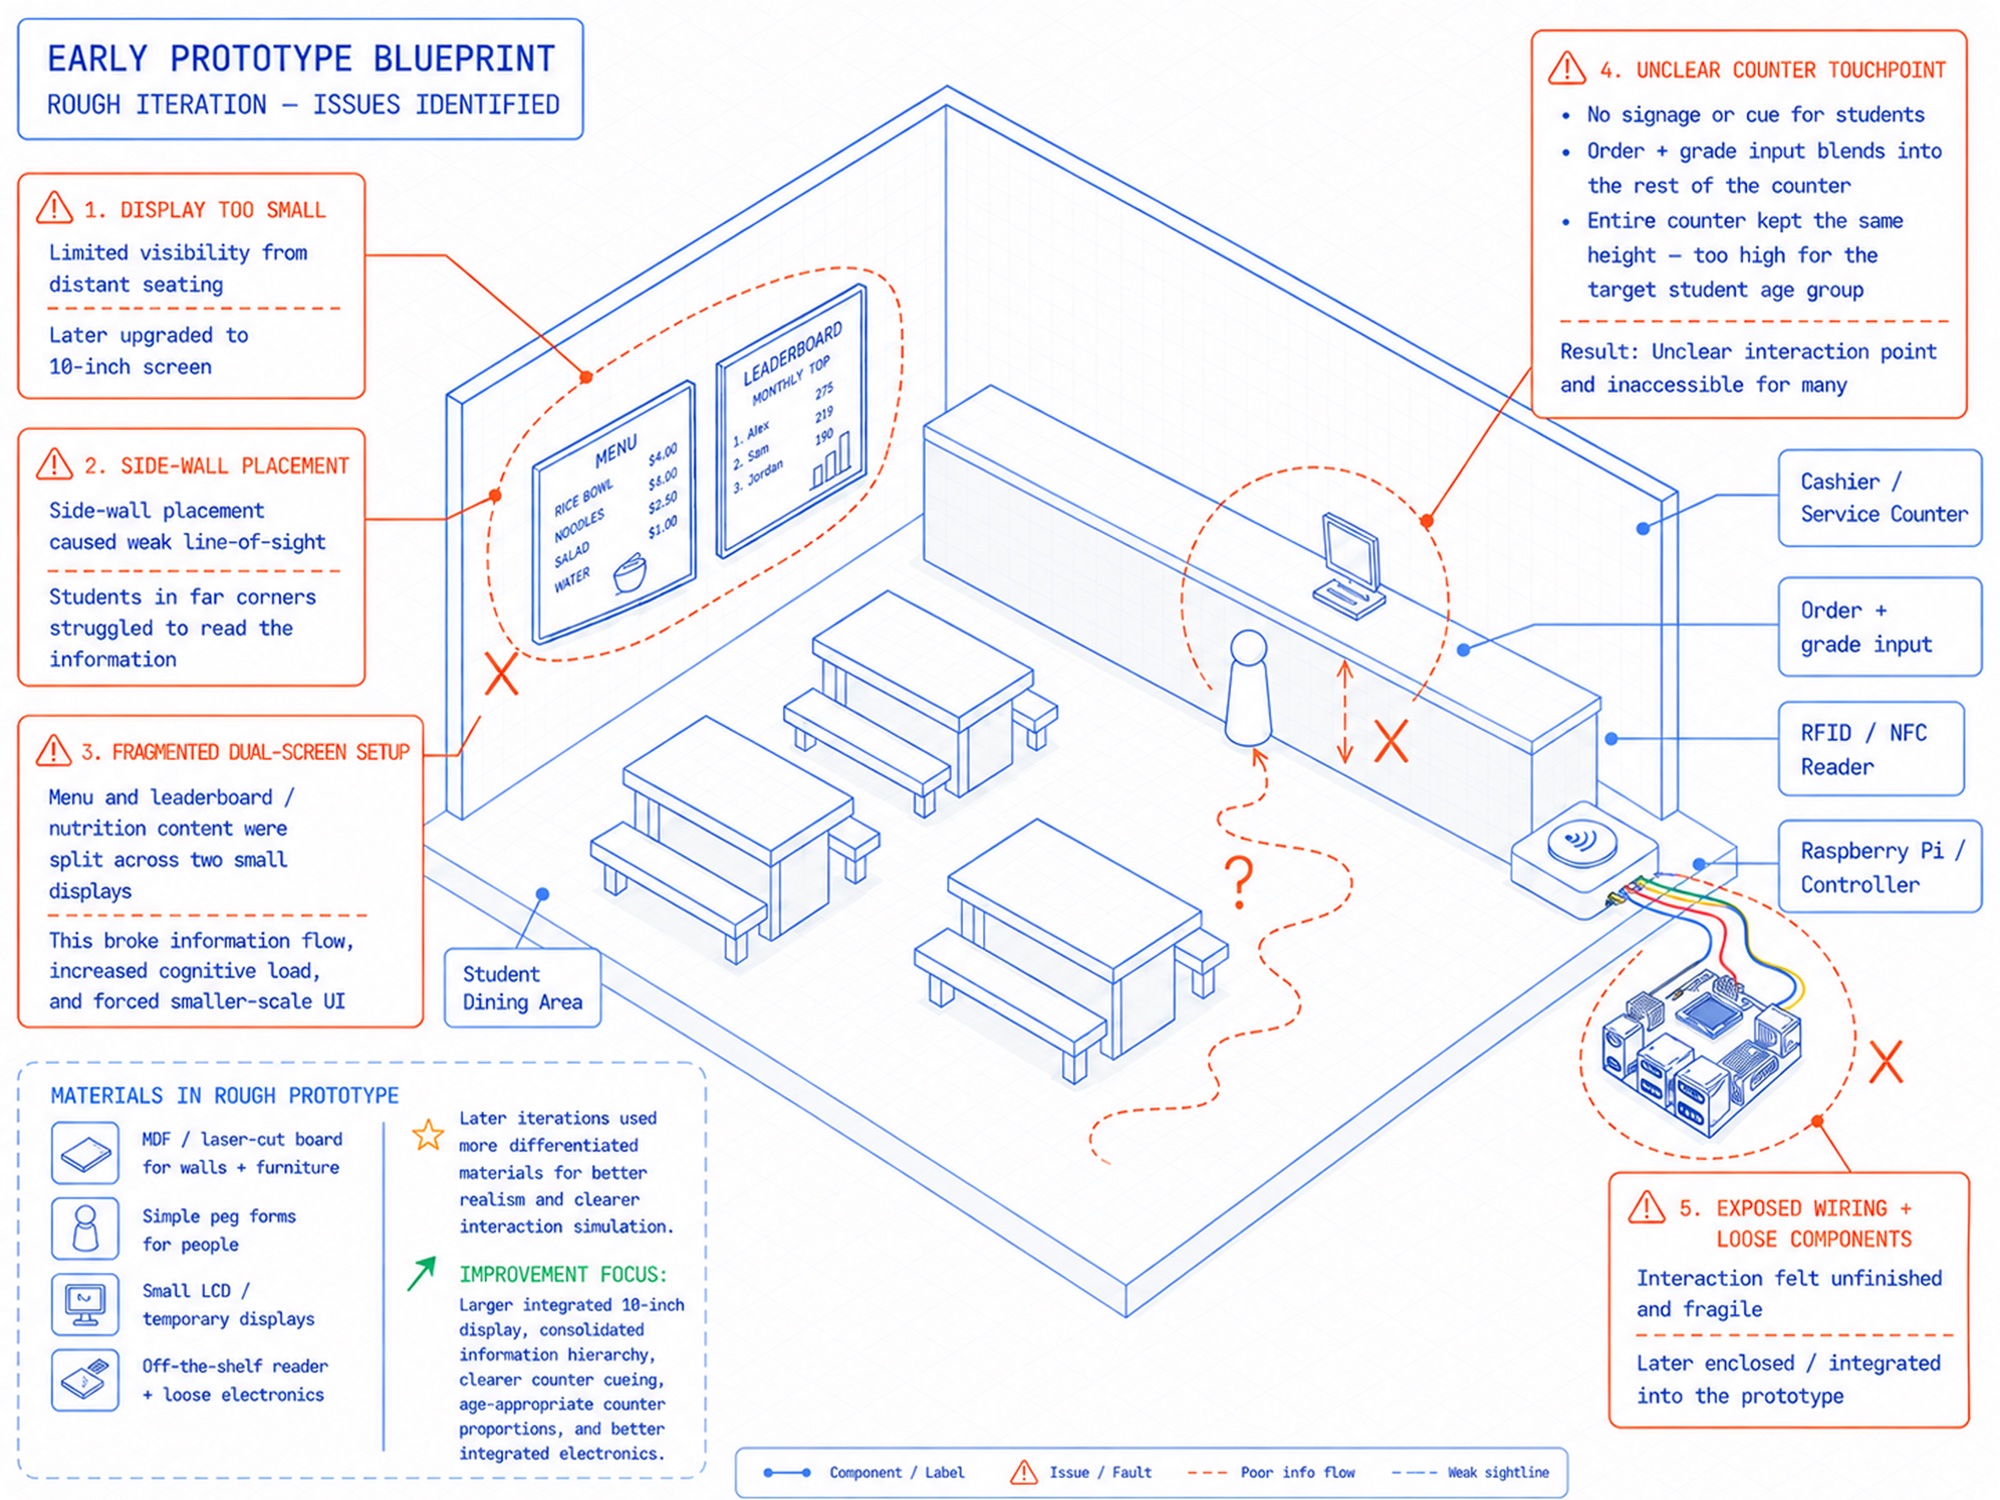
The first rough version of the physical model helped us identify several problems before the final build: the display was too small to be seen from distant seating, the side-wall placement created weak sightlines for students in far corners, the exposed wiring made the interaction feel unfinished, the counter footprint was too cramped for a realistic cashier workflow, and the dense seating layout blocked circulation paths. These findings directly shaped the next iteration: a larger 10-inch monitor for visibility across the room, integrated electronics for a more realistic and robust setup, and a refined counter and seating layout for better flow and sightlines.
To bring the concept to life, the team built a miniature physical model of a school cafeteria to demonstrate how the system would work in a real environment. The room structure and furniture were first modelled in Autodesk Fusion 360, then laser cut from MDF and assembled by hand; student figures were sculpted from clay where 3D printing was too small a scale. The finished model was used on demonstration day alongside the live Raspberry Pi and RFID reader setup, with the real touchscreen embedded in the model wall to show the system running end to end.
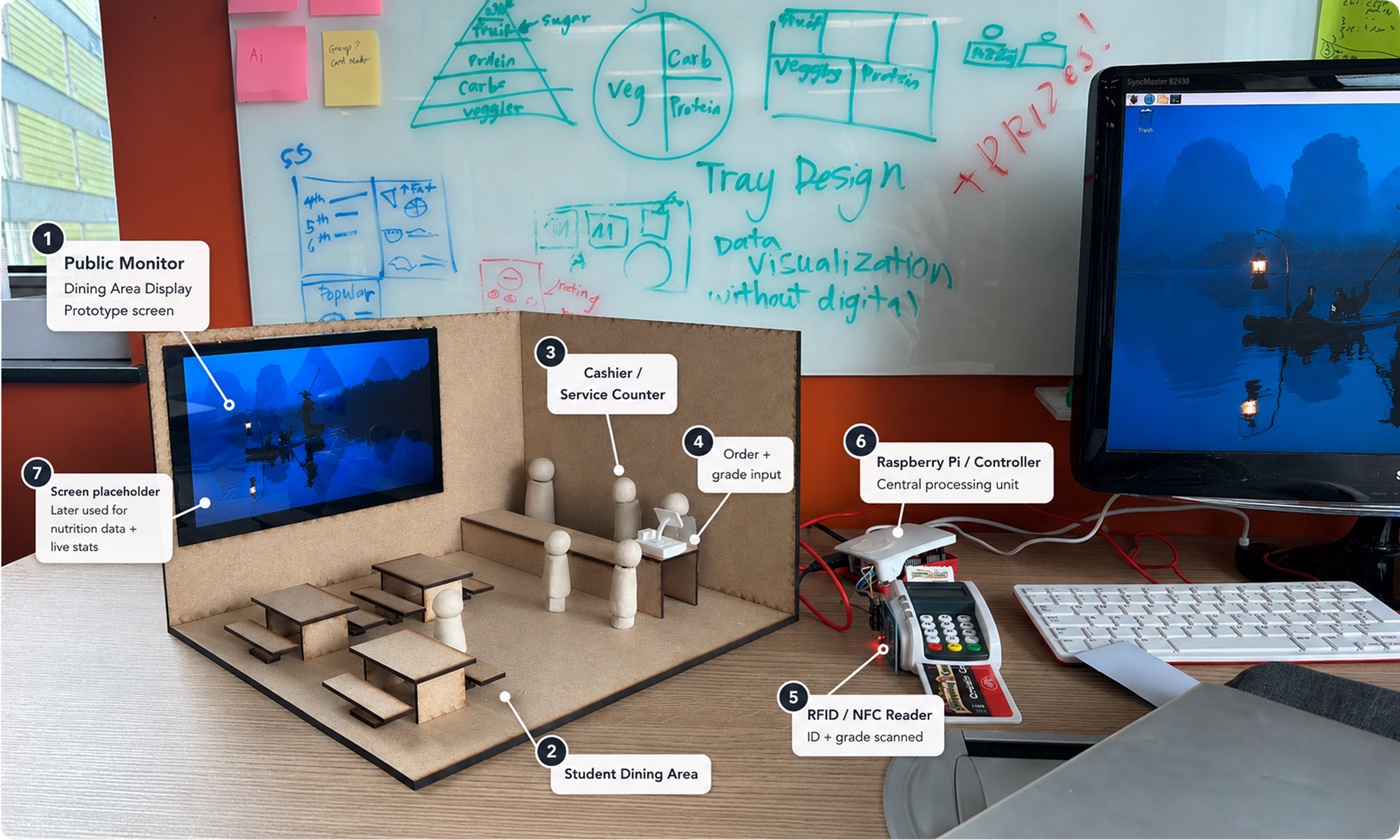
Annotated finished prototype
Deliver
High Fidelity Wireframes
We designed two interfaces for the system. The cafeteria display was a public-facing screen mounted in the dining area; the student app was a personal companion experience on mobile.
Today's meal choices with colour-coded nutrient bars, a weekly healthy-eating goal tracker by grade, the class leaderboard podium, and available prizes.
A real-time breakdown of the class's collective nutrient intake, plus a bubble chart showing how many students chose each meal.
Emoji-based face icons to indicate nutritional content per meal, later replaced after identifying it as conflicting with our no good/bad food language constraint.
Cafeteria display
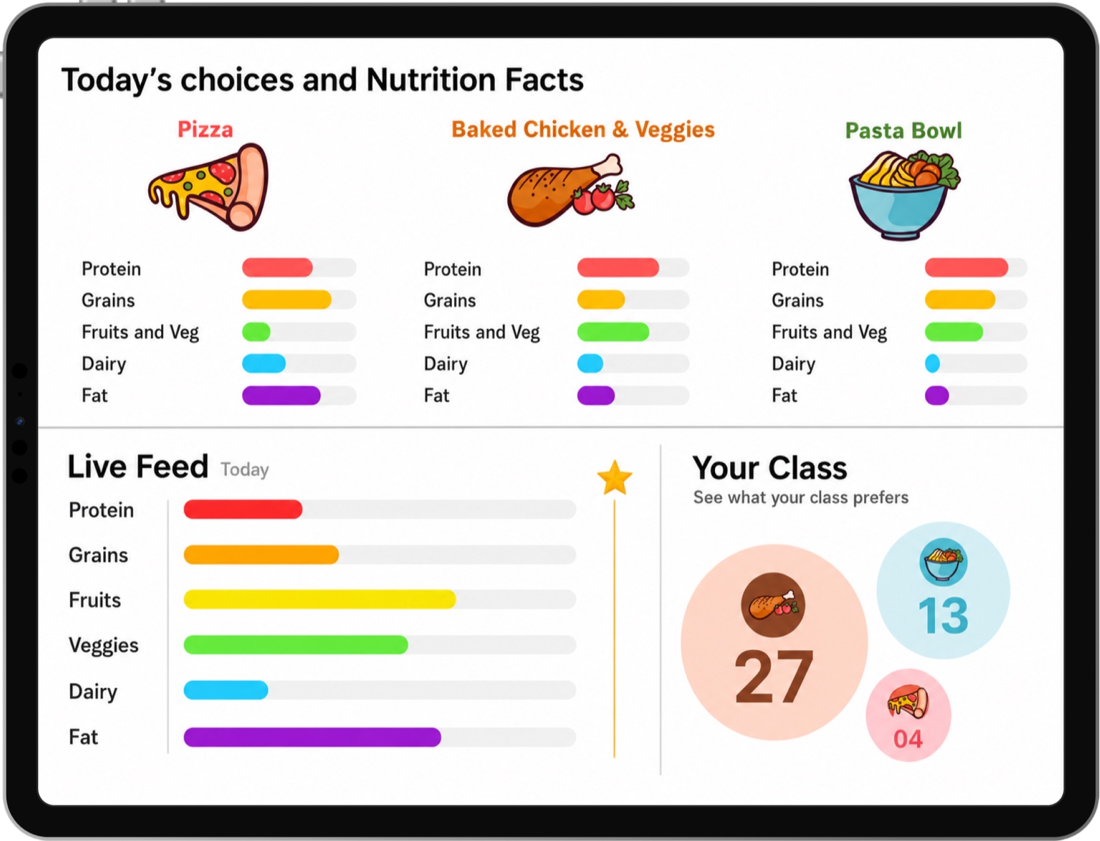
Live Feed View
Live prototype
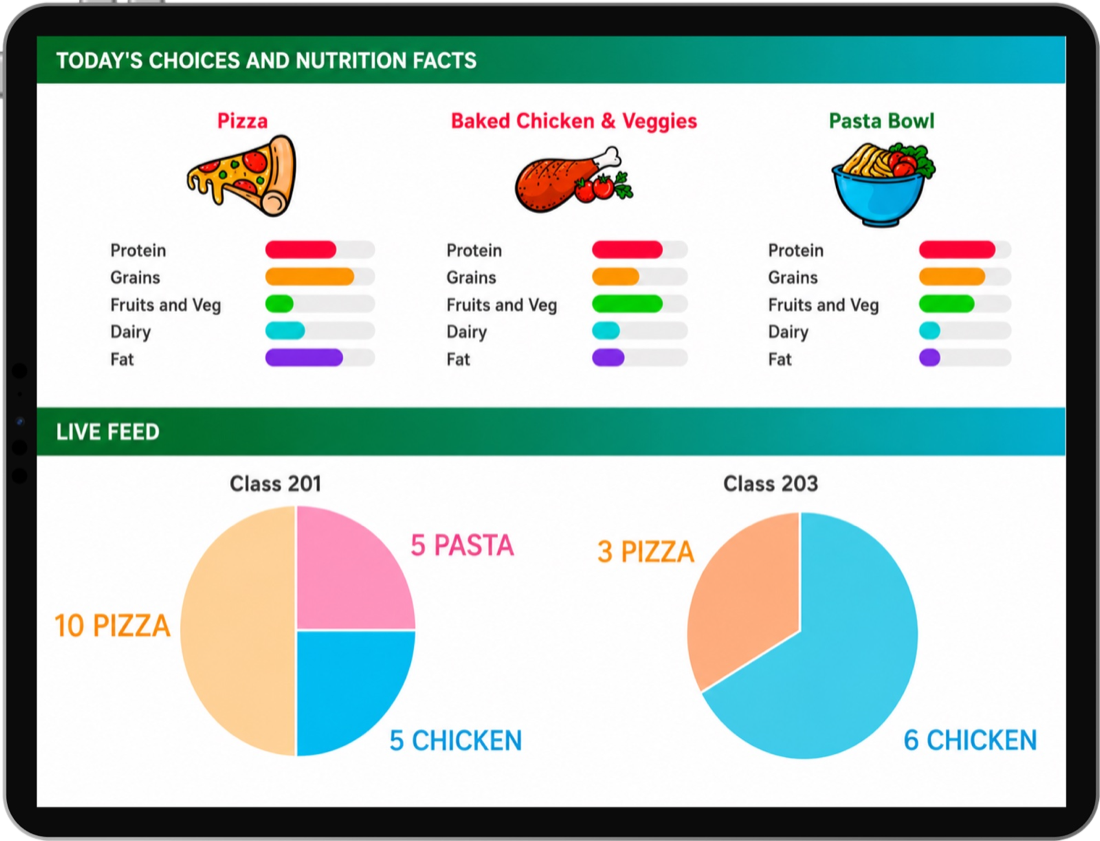
Public display running live
Student Interface
What the student ate, an ingredient breakdown, missing nutrients, and suggestions for what to try next.
Rate today's meal and vote on future menu options from a visual grid of choices.
A personal tab to set and track daily nutrition targets, and a class tab showing what the majority of the class ate, via a collective plate-nutrient diagram.
The final screens were built directly on the decisions made during the low-fidelity wireframing stage — the split-screen layout, the three-column meal card structure, the nutrient bars, leaderboard, and prizes panel all trace back to the original hand-drawn sketch. The key refinements were moving away from emoji-based good/bad food indicators to neutral colour-coded bars, and making the visual language more age-appropriate with larger illustrations, bolder colour, and simpler labels to reduce cognitive load for younger users.
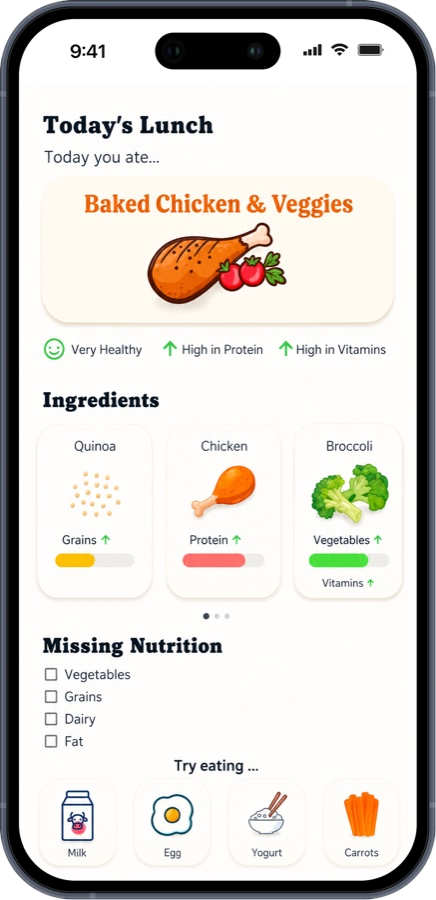
Today's Lunch
Access the work
The full source code and demonstration video are available below.
Reflection
Future scope & Enhancements
A physical redesign of school food trays using colour-coded sections to help students visualise portion sizes and balanced meals at the point of eating, without needing a screen.
The information density appropriate for a 12-year-old is different from what works for a 7-year-old. Usability and A/B testing across year groups would lead to tailored interfaces matching each age's comprehension level.
The system currently covers the essentials. Next steps include fixing pie chart rendering, adding a leaderboard page, enabling direct kitchen order submission, and replacing in-memory storage with a proper database.
Personalised meal recommendations based on a student's eating history and nutritional gaps — nudging students toward more balanced choices over time, without being prescriptive or judgmental.
Parents gain visibility into their child's eating habits across both school and home, closing the loop between the two environments and supporting healthier choices beyond the cafeteria.
Expand beyond individual schools to build a network of participating schools, enabling shared healthy eating challenges and community-level data that shifts the intervention from a single tool to a platform for collective social good.
Deploy multiple Pi units across a larger school or multiple schools, with a centralised database shared across all units, making the system viable at scale.
Learnings
Designing for a non-adult audience
Designing for children was harder than I anticipated. It pushed me to explore gamification and more visual elements. I learned that every design decision I made had to work harder to earn its place.
Research as a design tool
Reading nearly a dozen papers early changed how I approached every decision. I learned that research does not just validate an idea — it actively shapes the solution.
Growing as a collaborator
I have always preferred working solo. This project changed that. Collaborating with people from diverse backgrounds helped me become more open-minded, learn to delegate, and ask for help when I needed it.
Working within constraints
Not everything went to plan and four weeks was tight. When things did not work out, I had to adapt quickly. I learned that my ability to respond to constraints matters just as much as my original plan.
Bridging design and technical
Working with Tom on the backend taught me how my design decisions translate into development effort. I learned that design and engineering need to meet early — leaving it too late creates rework that could have been avoided.